An expression parser that reads what you write and answers in the
type you asked for. No grammar to learn, no visitor to implement, and for a
single answer nothing to create or free.
program Hero;
{$APPTYPE CONSOLE}uses
CalcUtils;
begin
Writeln(AsInteger('2 + 2'));
end.
That is the whole program: it prints 4. The matrix
compiles and runs it, so this listing cannot drift from what works.
P := TMathParser.Create(nil);
try
  Write(Answer(P):0:2, ' ');
finally
  P.Free;
end;
P := TJitParser.Create(nil);
try
  Writeln(Answer(P):0:2);
finally
  P.Free;
end;
Excerpt from samples/docs/swap.dpr: both
halves print the same 5.00, and the matrix runs the file to prove it.
One word, and the hot path becomes machine code. Everything
else - the formulas, the variables, the calls - stays exactly as it
was. Whatever the compiler declines, it hands back to the interpreter without
saying a word, so the answer is never fast but wrong.
How it works.
Priorities are datatry
reads as-
value-
Operators here are registered functions whose precedence is a
value, not grammar. Flip one and the same characters parse into a different
tree: raise * above / and 12 / 3 * 2 turns from 8 into 2
- the bracketed line is the parser's own decompiler reporting the tree it
actually built. Coverage is the second knob: how far a raised or lowered
priority reaches. Comparison ships as lower + total, which is why
1 + 2 = 3 compares the sum and answers -1, the parser's
true. Switch = to local and it binds neighbours only:
the same line now evaluates as
1 + (2 = 3), and the value flips to 1.
The engine is the real parser, compiled to WebAssembly. Plus and minus have no
knobs at all - they are how a script joins its items, not functions.
Reload the page to reset.
exactkey is the formula
text; a hit hands back the compiled byte-script
templatekey is that text
with the numbers cut out; a hit fills the number slots
self-sizingthe cache is
resized by formulas this same parser evaluates
Two caches sit under every parse, and the second is the
interesting one. The exact cache keys on the text. The
template cache first cuts every number out of the key -
5 + 7 and 2 + 3 are
both ?+? - so a formula the parser has never
seen still finds a script compiled for its shape, and all that is left
is to write 5 and 7 into its number slots. Exact first, template on a
miss; one compile fills both. The size is not a constant either: the
cache registers its own hit counters as parser variables and its policy
as two formulas, and when the hit rate leaves the band between a quarter
and three quarters, the parser evaluates them and resizes the cache it
is itself using.
LAYER IICrossGraph
Give it a range, and you have a picture.
Every point on this page came out of the parser - one formula, sampled
across its parameter. Turning those numbers into a line is a loop you already
know how to write; a ready-made component for VCL and LCL is a separate
package. What matters here is that the values are right: poles left open,
undefined stretches skipped, and the captions are the formulas exactly as
they were parsed.
The component adds what a plot actually needs: curves sampled across threads,
adaptive density, intersections, and extrema found rather than guessed, polar
and cartesian on the same canvas.
Exp (Sin T) - 2 * Cos (4 * T) + Sin ((2 * T - Pi) / 24) ** 5Temple Fay, 1989 · 24πCos (31 * T / 30)k = 31/30 · interferenceCos (Pi * X) + Cos (3 * Pi * X) / 2 + Cos (9 * Pi * X) / 4 + Cos (27 * Pi * X) / 8continuous, nowhere smoothSin (12 * T)n = 12, d = 163Exp (0.15 * T)spira mirabilisSin (X) * Sin (16 * X)beats · sin x · sin 16x
A panel inside Notepad++: type a formula, press build, read the
answer off the canvas. Nothing above is hidden from you - the plugin is
the component, and the component is the parser. It is built twice, by
Delphi and by Lazarus/FPC, from one set of sources and behind one
interface; the binary on the release page is the FPC one, so a free
toolchain is enough to reproduce it.
It also runs right here in your
browser - the same panel on the same engine, compiled to
WebAssembly. What the demo computes is what the plugin computes; only the
x86-64 accelerator stays native.
Numbers work as well as formulas. Paste a table into the
panel - two columns, any of the usual separators - and the pairs become
points on the canvas; selecting a table in the editor does the same
without the paste. Leave a blank line between tables and each one
arrives as a row of its own. Columns past the second are ignored.
A row appears for them beside the
formulas, and in that row you pick a fit: a straight line, a polynomial
of the second to the fifth degree, exponential, power or logarithmic.
The fitted formula is laid over the points with its R^2 and the caveats
that belong beside it. It is an ordinary formula from then on, so
everything else works on it - tracing, extrema, intersections, the
report.
Formulasas many as you like, each toggled and coloured on its own
Datapaste a table or a csv, or select one in the editor - two columns become points, a blank line starts the next row
Regressionfit a formula to those points: line, polynomial, exponential, power, log
Coordinatescartesian and polar, switched without retyping
Findsintersections between curves, minima and maxima, values under the cursor
Reportroots, breaks, monotone stretches, area and mean - computed, not guessed
Bookmarksten slots for the whole state, kept between sessions
Themesfollows the editor, light and dark
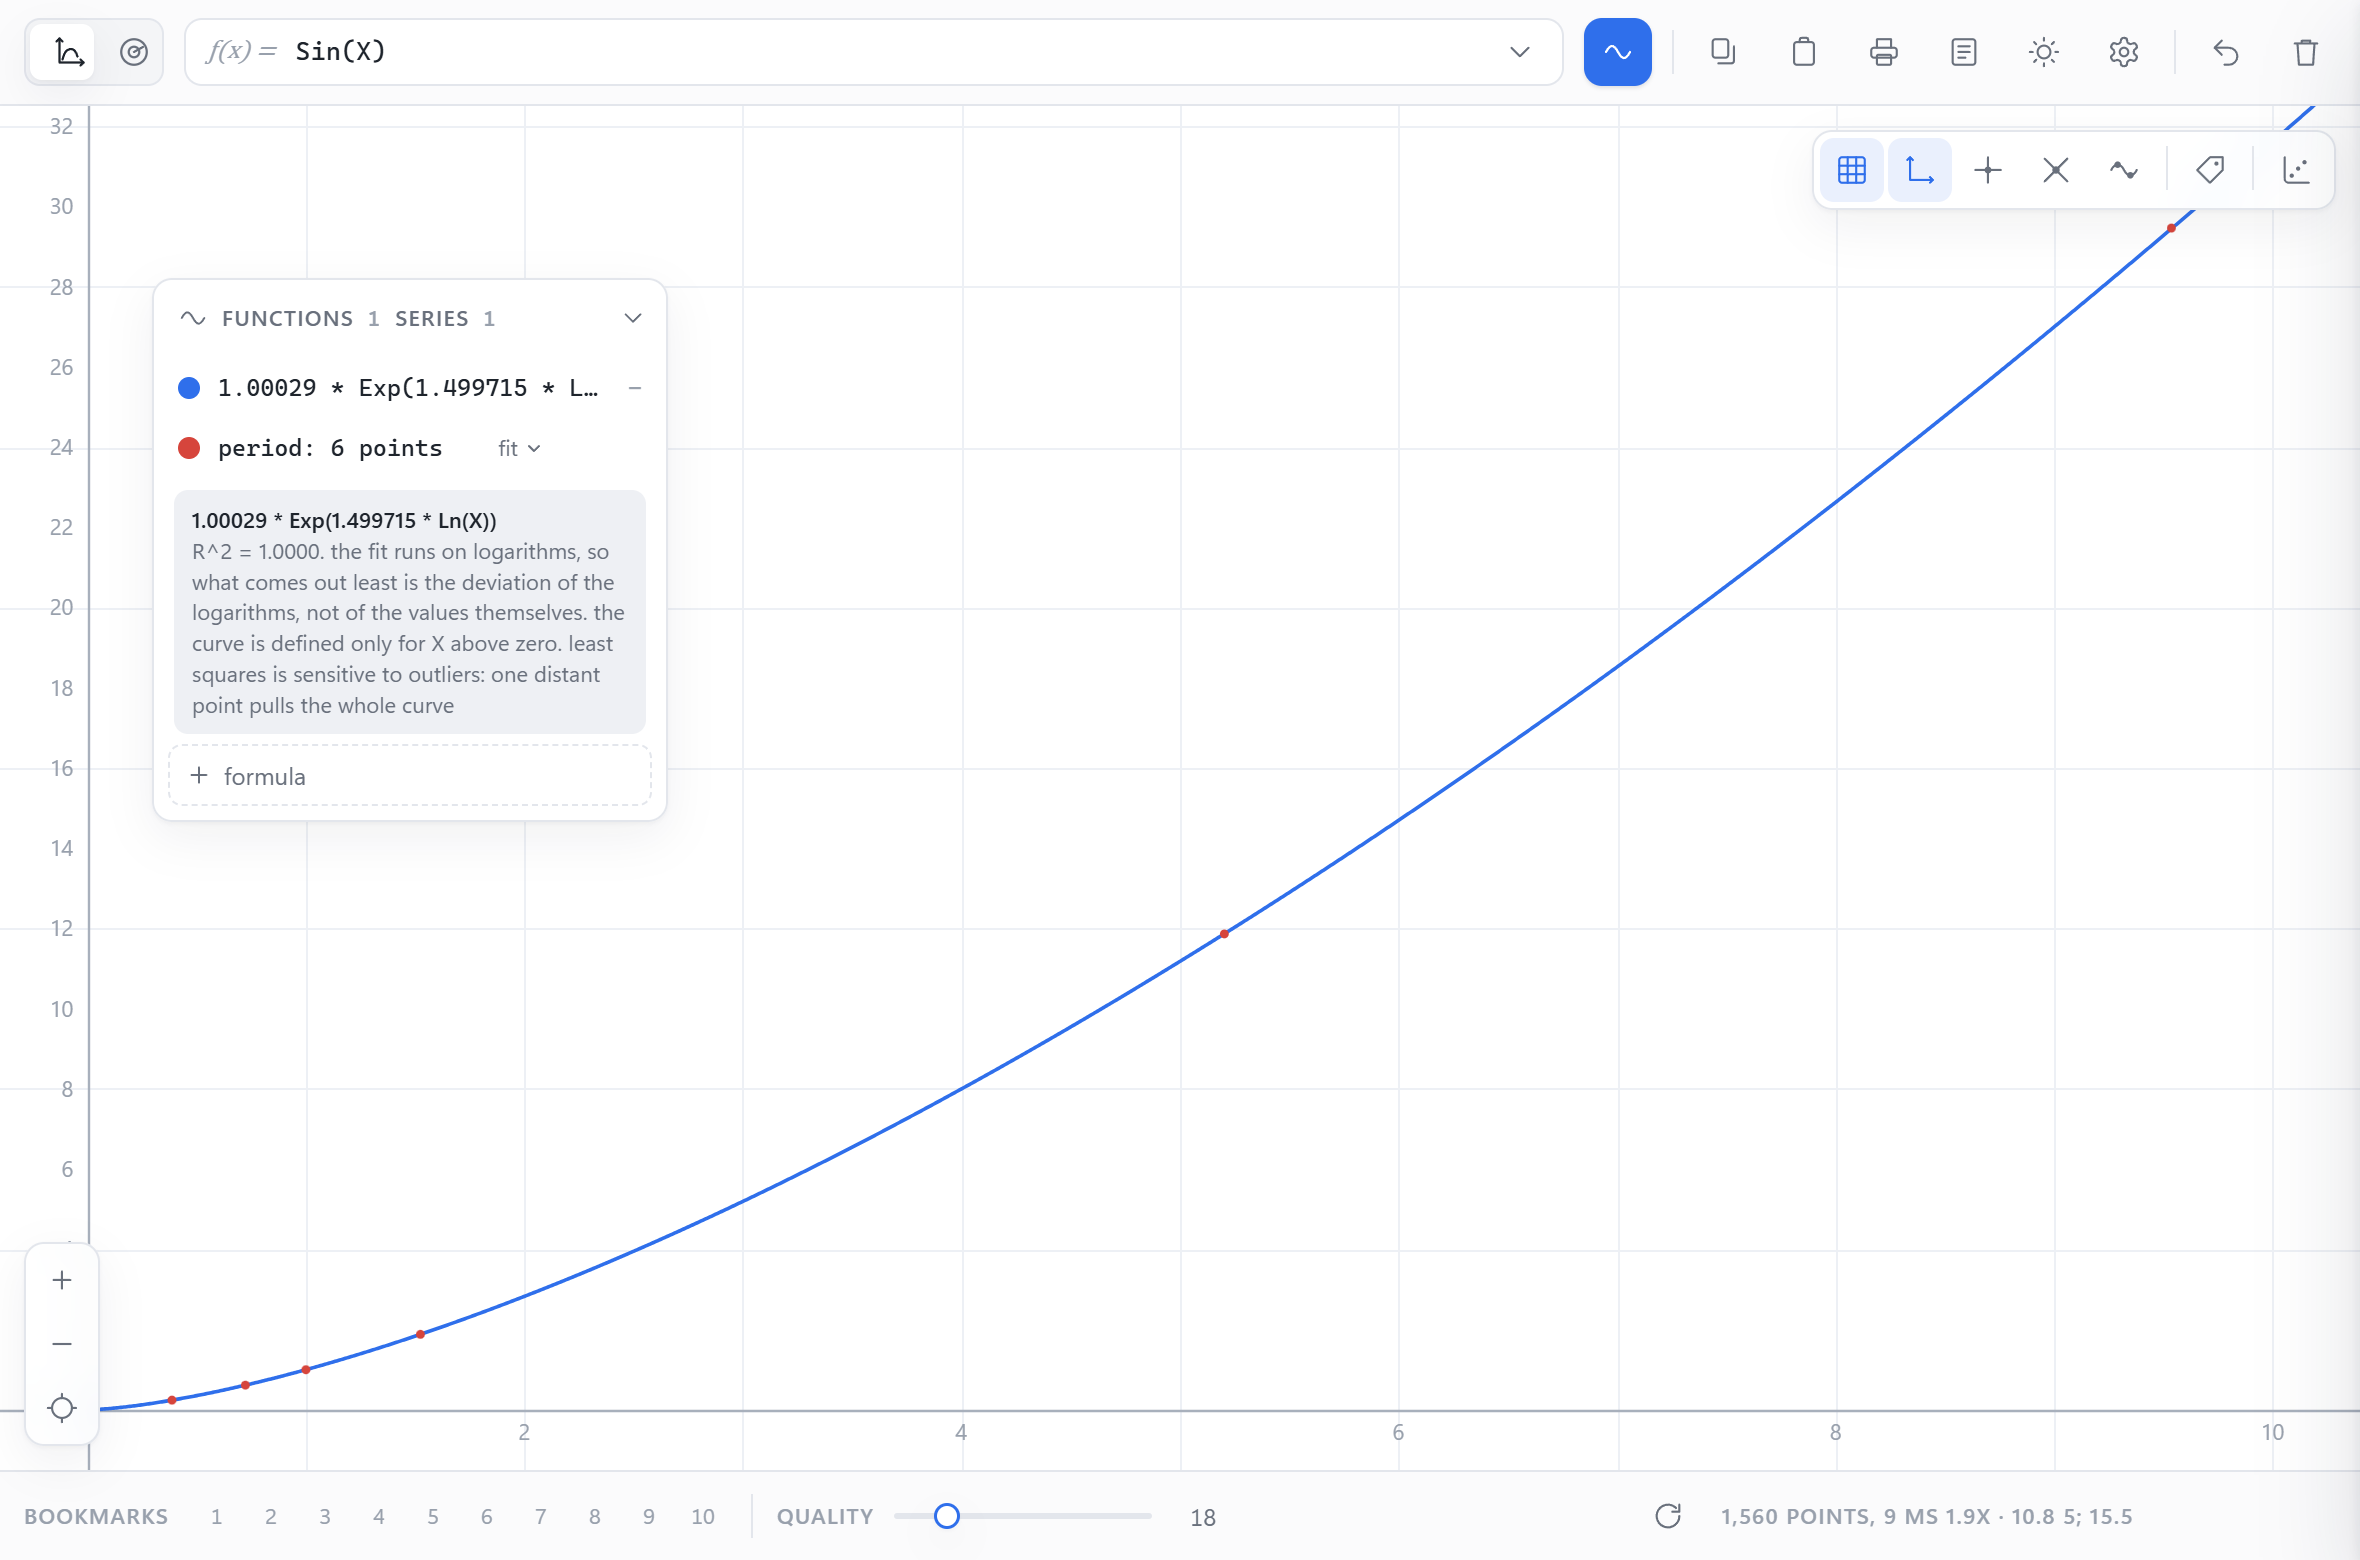
Six rows of a table, and out comes a law of nature.
Orbital radius against period for the planets from Mercury to Saturn -
the numbers an astronomy textbook gives. A power fit answers
1.00029 * Exp(1.499715 * Ln(X)): an exponent of 1.4997 and
a factor of 1.0003. That exponent is Kepler's third law, which took him
years of observation. Nothing was told to the panel except the six
pairs of numbers.
Copy the table, paste it into the panel, pick
power in the row that appears:
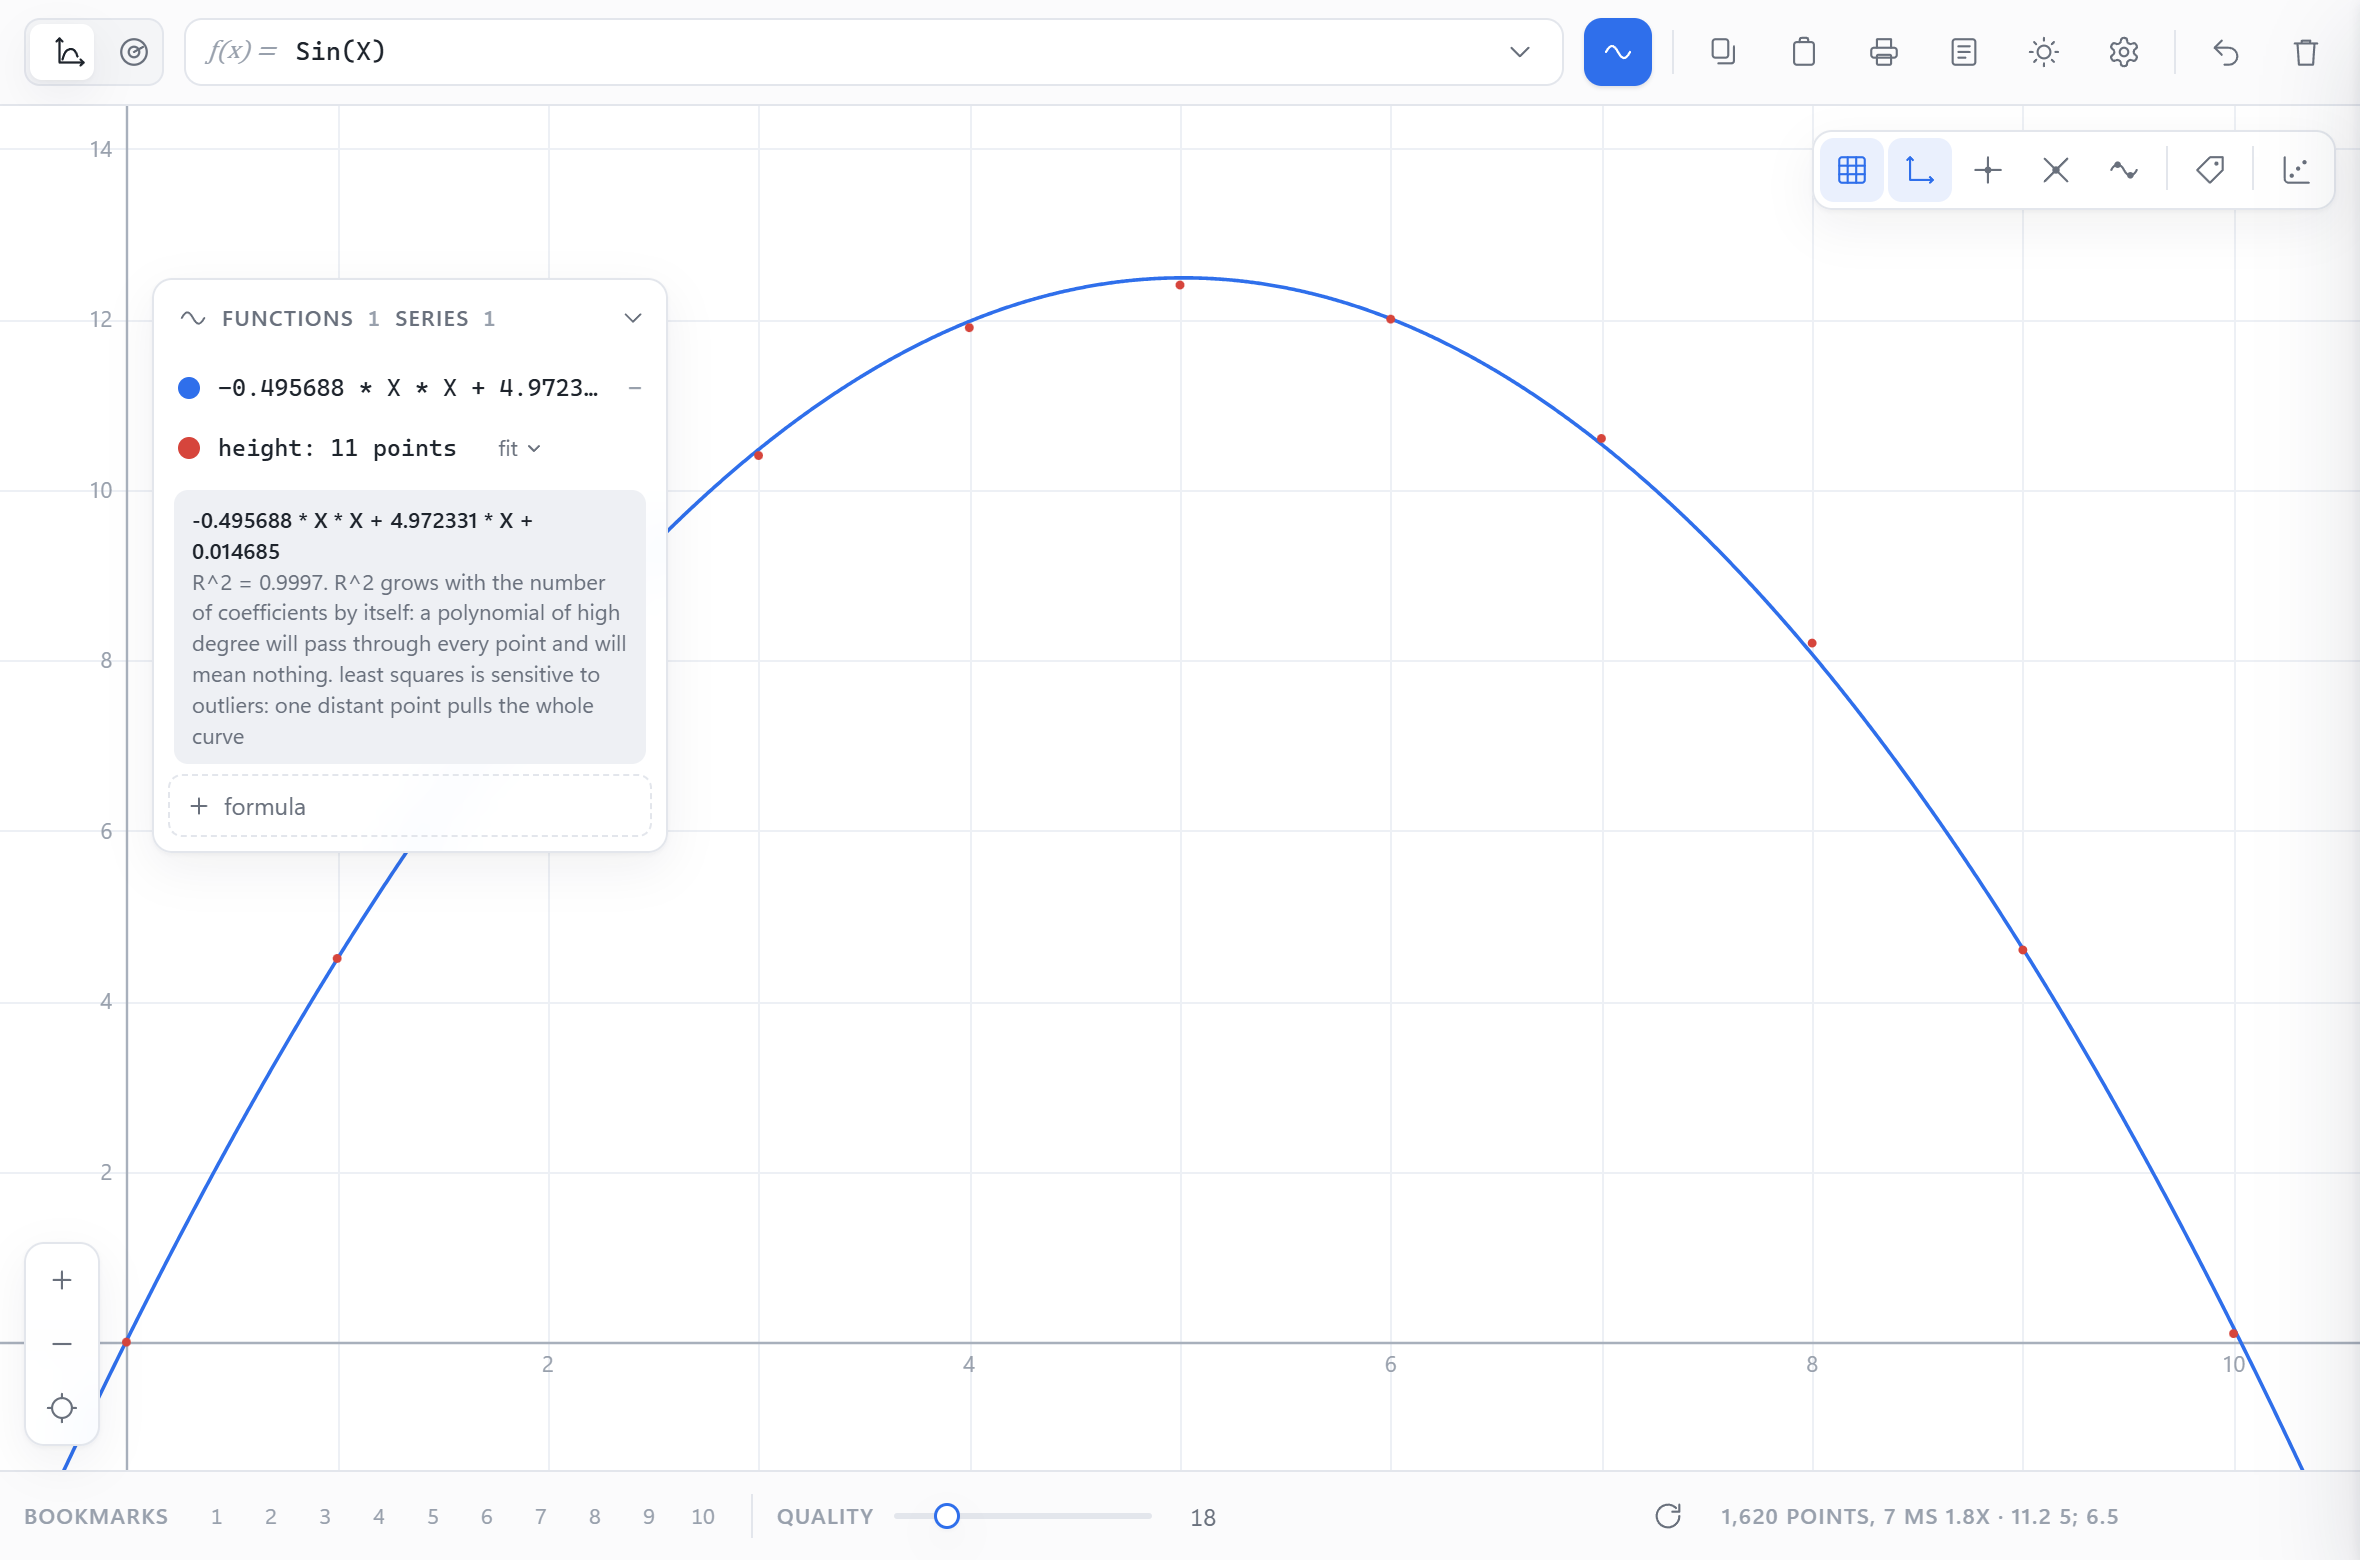
Eleven measurements of a throw, and the parabola behind them.
A polynomial of the second degree answers
-0.495688 * X * X + 4.972331 * X + 0.014685 with
R^2 = 0.9997. The caveat sits beside the answer rather than in the
documentation: R^2 grows with the number of coefficients by itself, so
a higher degree would fit better and mean less.
Same table, same two steps - pick
polynomial 2 this time:
A formula containing more than 64 compiled While or Repeat loops could continue running after its loop budget was exhausted or cancellation was requested. Such formulas now use the interpreter, which preserves both controls. Formulas within that capacity continue to use native code.
Changed
The Lazarus installation instructions now include installing both packages into the IDE, rebuilding Lazarus and checking the components on a form.
Unhandled commands are now logged by both plugin hosts
Fixed
Both plugin hosts now log commands received from the page that they do not recognize. The page and host maintain separate command lists, so a command sent by the page may not be recognized by the host. Previously, these commands were silently ignored. This change adds diagnostic logging only and does not affect button behavior.
The reference window of the panel now shows examples that can actually be typed. The description of repeat and the quotation marks in the examples have been corrected: repeat was described as a counted loop with an example the parser refuses outright, while the engine runs the body first and only then tests the condition; and nine examples were printed with single quotes, which this language refuses, because a string literal here is framed by a double quote. Both were corrected in the generator of the reference rather than in a copy of the file.
The panel now loads WebView2Loader.dll by full path from its own folder, in both hosts. Before, the Delphi host asked Windows for that file by name, and Windows resolves a name against the folder of the running program - the editor. In an editor where another plugin already carried an older loader, the older copy won, and the panel answered with a modal "Unsupported WebView2Loader.dll version" instead of opening; measured on 3 October 2026 with NppMarkdownPanel installed, expected 1.0.4078.44, found 1.0.3650.58. The RTL hook that names the path exists only from Delphi 12 Athens on, so on 11 Alexandria the host keeps the pre-loading by full path alone and says so in the panel log.
Changed
This release includes the browser demo's view-fitting fix, which has been live on the site since 21 September 2026. The fix was originally deployed separately from a numbered release. The site itself is unchanged.
Both README files now explain how to build the published packages and the getting-started sample, each using a separate, clean build configuration. The Trunk configuration has not been tested.
Axis labels that thin out on their own, and an example that runs on Linux
Fixed
The getting-started example of CrossGraph stopped at startup on Linux with runtime error 232, "Threads not supported". The component draws in a worker thread, and Free Pascal on Unix compiles thread support in only when cthreads is the first unit of the program; the example did not name it. Reproduced here on 3.2.2 - the version it was reported from - where the same program exits with 232 without that line and runs with it.
Axis labels are spaced by density instead of two fixed rungs. The step was either 2 or 4 and always a whole number, so the axis thinned out exactly once, at a view of about twelve units. Zoomed out to a thousand the canvas took five hundred labels under two pixels apart; zoomed in below one unit no whole numbers were left in view and the axis carried no labels at all. The step now comes from the series 1, 2, 5 and powers of ten in both directions, chosen so that neighbouring labels stay at least 56 pixels apart, and fractions appear once the view is finer than a unit.
The panel keeps its proportions after the view-fitting button is pressed. The view arrived from the plugin with a height taken from the data, and a locked ratio was ignored on that one path: a circle came out as an ellipse until the window was resized, at which point the resize handler recomputed the height and quietly repaired it. The rule that size() already applied now applies here too.
A cleared sheet stays cleared. Clearing the panel, switching the coordinate system and coming back used to bring in the two built-in example formulas: the mark that says the sheet was emptied on purpose was dropped when a formula was picked up from the editor under the caret. A sheet you have never opened still shows the example - that part is intended and unchanged.
A curve keeps its origin across a change of coordinate system. Everything about a curve travelled to the other sheet except the note of where it came from, so clearing the selection removed a curve in one case and not in the other - which is what "floats, about every other time" in the report describes. The note now travels with the curve, including through the state the editor keeps between sessions.
The menu item and the panel title name the same action with the same words. The item read "Plot the selection" while the title explained the same key combination with "grab", and nothing tied the two together for a reader.
The cursor over the plot tells the truth in report mode. The canvas carried an open hand because the graph is dragged with the mouse, and dragging is refused while the report is shown - the hand promised an action that would not happen. It is an ordinary pointer there now, and an unfinished drag is dropped when the report opens.
Changed
Five of the seven fixes above come from one reader who went through 1.3.6 and wrote down what he found. Nothing in the interface moves, and no setting changes meaning.
Tests that open in Lazarus, and a stand-in unit that stops taking a name the LCL uses
Added
A getting-started project for CrossGraph: a whole application in seventy lines - a form, the component filling it, two formulas and Build. The form is assembled in code rather than in a .lfm, so the example does not depend on the version of the form format.
An .lpi beside every test of CrossGraph. The packages shipped with plain .dpr files and nothing that opened as a project in Lazarus; the .lpi points at the .dpr, so the Delphi side keeps working as before.
Fixed
Building the parser against the LCL on Linux stopped on a duplicate Messages unit. The package adds its stand-in only when the target is neither win32 nor win64 - which is exactly where the LCL carries its own lcl/nonwin32/messages, so the clash was not a matter of luck. The stand-in is Compat.Messages now, a name of its own; on Windows nothing changes for the caller.
Two tests of CrossGraph were written for Delphi alone and did not compile under FPC at all - a third of that folder was unavailable to anyone on Lazarus. Both build and run there now.
DrawTests did not start under the LCL: it drew before the widgetset was up. It brings the widgetset up first now.
Changed
The plugin itself is unchanged in 1.3.6. It is rebuilt and renumbered because it is built from the same tree as the packages.
Curves that leave the window, and a panel that remembers what you did
Added
Redo. Undo has been there for a while; what it undid was gone for good. Ctrl+Y or Ctrl+Shift+Z now puts it back, and the redo trail is dropped the moment you change something else - the same rule every editor follows.
A button that fits the graph to the screen. It takes the widest and tallest the curves actually go and sets the view to that, so a formula whose values live far from the origin no longer needs the view dialled in by hand.
A button that hides the list of functions and brings it back. Docked to the side the list takes most of the panel, and until now it could only be scrolled away, not put aside.
Bookmark cells can be copied and pasted one at a time. The ten cells inside the panel are unchanged; what is new is that a single cell can be taken out through the clipboard - into a mail, a file, another machine, another person - and put into any cell on the other end, not only the one it came from.
Fixed
A curve that ran past the top or bottom of the window came apart into pieces. Every excursion past an edge started a new piece, so sin(x)*3 in a window one unit high arrived in seven pieces instead of one, and there was no telling those breaks from a real discontinuity. A break is now decided by the curve itself - a step that lands past the opposite edge, which only a pole does - so 1/x still breaks at zero and a continuous curve stays whole.
A curve leaving the window stopped short of the edge instead of running into it. The point past the edge was thrown away, and with nothing to draw towards, the line ended early.
In the report, every formula colour dot was drawn in the pen colour, so with multi-coloured curves the dots did not match the curves they stood for.
Extremes were marked at the nearest grid node rather than at the actual turning point. With x*x the minimum sits exactly on a node and the error was invisible; off a node the mark was visibly beside the peak.
The note under the reference list is no longer glued to the list, and reads the same way for a curve, a bar chart, an area and a boundary.
The Color property could be pushed off the bottom of the component designer form at larger font sizes: the row count was already at its maximum, so the last property had nowhere to go.
Moved to another machine, the panel looked for its page in the wrong folder and fell back to the old window without saying so. It now writes down which file it looked for and did not find.
The library and the page check each other version at startup. A build that pairs a new library with an old page is reported instead of running.
Measuring text width is safe to call from several threads at once. The functions shared one screen device context between them.
Under FPC, a guard on the angle before sin and cos stops the geometry from raising an invalid operation where Delphi returned a number.
Under FPC 3.2.2, clipping a segment could return the wrong points. The cause is a compiler defect - a chain of array concatenations puts the last element in the wrong place - and the fix splits the chain into two steps rather than waiting for the compiler.
Changed
The panel opens on Alt+B, and building the selection is on Alt+Shift+B. It used to be Alt+G, and on any machine with Chrome installed that combination now belongs to Gemini system-wide: the plugin never sees the key, the panel does not open, and it looks as though the plugin does not work. If you had rebound the key yourself, Notepad++ keeps your choice.
The panel title names both shortcuts and shortens itself as the panel gets narrower rather than cutting the text off. When only one shortcut fits, the one that stays is the capture: the panel can be opened with the mouse and from the menu, the capture cannot.
The two clipboard buttons say what they do - copy state to the clipboard and paste state from the clipboard. They were labelled as though they saved and restored the state inside the plugin, which is what the bookmarks do.
Palette icons, forms that open again, and the panel tidied up
Added
Palette icons for every component the IDE puts on the palette: twelve in Lazarus, eleven in Delphi. The odd one out is TGraph - CrossGraph ships a Lazarus package only, so it has no Delphi palette entry to carry an icon. Until now they shared the default square and were told apart by name alone. Colour says what a component is for - parsing, calculation, timing, data, drawing - and the silhouette tells one from another at the size the palette actually shows them.
Both sets ship inside the packages, in the resource format each IDE reads by itself. Lazarus reads a standard resource rather than an .lrs one, so the package still does not drag in the LCL where the LCL is not wanted.
Fixed
Components could not be saved to a form and read back. A published read-only property of a class type is written by the streaming system as a NAME and read back as a reference to a component with that name, which does not exist. A form holding a TParser was written without complaint and refused to open afterwards.
Forms already saved by an earlier version kept failing on that same property. Not streaming it fixed new forms and left old ones failing to load, so the five sub-properties now accept what they are given and ignore it. An old form opens; a new one carries nothing to ignore.
A lone dot from the editor selection was taken for a formula and drew an empty curve. A line counts as a formula when something in it can yield a value - a letter or a digit - so pi and exp stay formulas, and punctuation on its own does not.
The ^ sign is called out where it means exclusive-or rather than a power. Written between two values it almost always means a power was intended, and the status line says: ^ is not a power - use x ** 2. The bar is narrow, so the note is kept to what the reader has to do and the whole sentence stays in its tooltip. Where the formula is already right, it stays quiet.
The settings window let the graphs behind it show through sharply. It blurs its backdrop now, the way the function panel already did.
Formula colours were lost in the report and in print: the browser drops colour by default, and colour is what ties a row of the report to a curve on the canvas.
With the window docked to the side, the function panel covered the row of graph buttons. Below a certain width the buttons move to the bottom of the panel instead.
The panel said the hotkey captures the selection; it opens the window. The wording of both the button and the shortcut now says what they do.
The count in the note under the reference list ran into the words before it: all of them,212 and shown17. A trailing space was carried on one side of the translation table and lost on the other.
The panel answers the notes, and the parser stops guessing
Added
A button on the editor toolbar and the shortcut spelled out in the panel title. The icon is drawn in code rather than shipped as a picture; that the button really appeared is proved by counting the buttons with the plugin and without it, because the editor answers TRUE to the request either way.
A reference of signs and functions behind its own button, every entry described. The list is generated from the registry of the parser itself and checked against it, so the reference cannot contain a name absent from the name table of the parser, or omit one present there.
Bookmarks became split buttons: the main part restores, the arrow offers overwrite and clear. An empty cell has no arrow.
Colour, width and dash per curve. The circle in the formula row now shows what the curve is actually drawn with rather than a shade picked by position.
A formula can be edited in place by double-clicking it, undo included.
In polar mode the angle range is shown only there, with buttons for one, two, three and five turns.
Fixed
Pasting a table read ONE table while a selection could hold several, and the point sets silently merged into one. A blank line between tables now starts a new row, columns past the second are ignored, and selecting a table in the editor does what pasting does.
The sign of a number did not reach the key of the template cache, so X + 400 and X - 400 shared one key and the second was evaluated by the script of the first: after X - 400 the expression X + 400 answered -398.5 instead of 401.5.
Sin(2) ** 3 was evaluated as Sin(8) and Ln(100) // 2 as Ln(10): the power and root signs after a function call went inside its brackets. The answer was wrong rather than refused, which is the harder case to notice.
An exponent with a sign did not read at all - 2.5E-2 and 3E+2 were refused - and a name E cut 1E3 in half. A number is now indivisible to the tokeniser.
Names that read as numbers (E3, X1, $FF, &17, %1010) were silently swallowed by number reading, differently on FPC and on Delphi. They are refused at registration now.
A per cent sign in text written by a person turned an ordinary parse error into a conversion error.
Extremum marks were thinned for the zoom they were computed at, so zooming out fused the arrows into a solid block - a square instead of an arrow. The rule now applies when drawing as well.
Thirty five English messages of the parser were rewritten and one was added.
The 1.3.1 plugin crashed Notepad++ the moment the panel was opened, and the download has been removed. A record that the plugin hands to the editor was laid out four bytes short of what the editor expects, so the editor read the module name from the wrong place and dereferenced whatever was there. The record is a C structure, and the directive that keeps it C-compatible was cancelled by a later one; on FPC 3.3.1 the two agree, on the 3.2.2 the README asks for they do not. 1.3.1 was the first release built with the compiler the README names, which is why the fault surfaced there.
The Delphi build looked for the compiler in one fixed folder and only ever found RAD Studio 13. It reads the installed versions from the registry now, so 11 Alexandria and newer build as the README says. Set BDS_BIN to pin a particular installation.
The build and install scripts asked for pwsh. PowerShell 7 ships with no Windows at all, so the recipe stopped on its first command for anyone who had not installed it separately. The scripts run under the PowerShell that comes with Windows, and the instructions say powershell now, with the execution-policy switch that a downloaded script needs.
The Notepad++ plugin opened with different settings depending on which of the two builds you installed: the zoom step was 0.5 in the Delphi build against 0.1 in the Lazarus one, and six other numbers differed with it. Both builds now carry the same defaults and seed them into the component before anything saved is read.
A table becomes points, and the points become a formula
Added
A selection in the editor is plotted while you are making it. Select a pair of columns in a csv and the points appear on the canvas at once; the next selection replaces them, so nothing piles up. Alt+Shift+G keeps what is shown for good, as an ordinary row of the list.
Text with numbers becomes a series of points. The separator is worked out from the data - a semicolon, a tab, a comma, a space - and a decimal comma is not mistaken for one. A header row names the series. Points are drawn as points, not joined by a line: a line between measurements would draw values where nothing was measured.
A formula is fitted to those points: a straight line, a polynomial of the second to the fifth degree, exponential, power or logarithmic. The result is an ordinary formula string, so everything already there works on it - tracing, extrema, intersections, the report, bookmarks, the share link.
The caveats stand beside the answer rather than in the documentation. R^2 grows with the number of coefficients by itself; the exponential, power and logarithmic fits are computed through logarithms, so it is the deviation of the logarithms that is least; least squares is sensitive to outliers.
Undo. Ctrl+Z, or the button next to the bin, takes back the last destructive action - clearing the panel, removing a curve or a series, a fit. Twenty steps, and the tooltip names what will be undone.
The panel says why it is empty. Without the WebView2 runtime it used to stay blank with no explanation; now it names the reason and what to do about it.
Fixed
The colour you picked is the colour the curve is drawn in. While "a colour of its own for every formula" was set, the chosen colour was not used at all, and the control looked as though it worked. Picking a colour now turns that mark off, and the switch for it stands in plain sight.
A bookmark slot stays occupied after you restore from it, and you can return to the same bookmark as many times as you like. Restoring used to free the slot, so click after click went remember - restore - remember. Ctrl+click writes over a slot, Shift+click clears it, and both gestures are written in the tooltip.
Printing puts the whole report on paper, not the part that happened to be visible. The report lived in a scrolling window and was clipped along with the scrollbar; the graph is printed too, on a page of its own.
Clear stands at the end of the button row, behind a separator, with undo before it. It used to sit between Print and Report - three neighbours, two of which show something and the third wiped the list without a question. It now clears the whole panel, series included, and the caption says so.
A formula whose values run off to infinity no longer brings the browser demo down. X // Sin (X) beside other curves made the build fail outright: near the zeros of the sine the chord between neighbouring nodes came out infinite, and the search for touches let it through - both of its gates compare on "greater", and infinity on the right lets everything past. The plugin was never affected: there the intersections are computed by the engine, and in the browser they are written again in JavaScript.
An extremum is a property of the function, not of the sampling
Fixed
The extremum marked on a curve was the nearest computed point rather than the extremum itself. Three things followed from that, and a reader of the plugin noticed all three: for y = x*x the answer was not zero and did not agree with the value the report printed; the mark moved when the window or the quality changed, because the grid of computed points moved with them; and raising the accuracy brought the answer closer without ever reaching it. The vertex of the drawn polyline now only opens the search - the extremum itself is found on the function, by ternary search inside the bracket the vertex gives. Measured on a shifted parabola, a shifted sine and a cusp: the answer lands within about a hundred-millionth, and it is the same answer at two different zooms.
A parabola tested at a symmetric window passed while all of this was still wrong, because zero fell exactly on a grid point and the right answer came out by alignment rather than by calculation. The checks that guard this now put the extremum deliberately off the grid, and ask for the same answer at two zooms rather than one.
The build button carried a word next to its icon. The word is gone; the button keeps its name for the tooltip and for a screen reader. In a docked panel this also takes pressure off the width of the row, and a row that wraps is what used to make the panel rebuild itself.
The parser and the plotting engine build on Delphi 10.2 Tokyo through 13; the plugin builds on 11 Alexandria through 13. Every version in that range is a real installation rather than an expectation: before a release each one compiles the units one at a time, and the range printed in the README moves only when that run agrees. The plugin stops at 11 for a reason that is not in our code - it reaches WebView2 through a unit Embarcadero began shipping in the RTL with that version, and on 10.2 through 10.4 the unit is simply absent.
Fixed
A version test stopped the build on every Delphi up to and including 11. One unit chose between two shapes of an iterator callback by testing a Free Pascal version constant, and the test sat inside a branch Delphi never takes. That is not as safe as it looks: Delphi evaluates the expression regardless of the branch, meets a constant it has never heard of, and stops. The choice is made by generation symbols now, which either exist or do not and need nothing evaluated to find out.
An array literal bound to the wrong type on Delphi before 12. Until that version the dynamic string array and the generic array of string are two distinct types rather than one, so a literal passed to a parameter taken by reference bound to the type the call did not want. The two calls in the parser and one declaration in the plugin build their array in a variable now.
The token handed back by GdiplusStartup changed type in the RTL between 10.3 and 10.4, from a plain unsigned long to a pointer-sized one. It is taken by reference, so the mismatch was an error rather than a warning, and the plotting engine would not build on the two older versions. The variable is declared by a numeric test on the compiler version now.
A form knows its own pixels per inch, but that property is protected until Delphi 11, and the dark-theme code read it directly. An accessor class opens it, and the one line now works on every version without a version test of any kind.
A conditional symbol with a dot in its name does not ask what it appears to ask. Delphi cuts the name at the dot, so the symbols naming the point releases of the 10 line all resolve to the same thing and answer yes as far back as 10 Seattle. Measured on a 10.2 installation, all three of them answer yes. Tests that have to tell those versions apart use the numeric compiler version instead.
Dropped on a form under Free Pascal, the graph component could take the application down with it. The component drives itself from a precise timer, and the two compilers give that timer different lives: under Delphi it is a window timer whose handler runs in the main thread, under Free Pascal the same class runs a thread of its own and calls the handler there. So the handler painted from a worker thread while the main thread painted the same control, and the pen cache of the LCL does not survive that. Measured before the fix: six crashes in ten runs; after it: none in a hundred and fifteen. The handlers no longer do the work - each posts a message to its own window and the work happens in the main thread. The contract of the timer is now written down in the header of its unit, so the next reader does not have to discover it from a crash.
The component came up black on a form under Lazarus. Under the LCL the default colour of a control is not a colour at all but an instruction to ask the environment for one, and an off-screen bitmap has no environment to ask: the request resolved to black, while the same line under Delphi produced the ordinary window colour. The buffer is filled with a resolved colour now, and the two fonts the component owns are given explicit defaults instead of inheriting the same uncertainty.
The packages compiled and then did nothing: the components never reached the palette. Three things were missing at once - none of the packages declared itself usable at design time, eight units registered components without saying so in the package description, and the parser package declared no dependencies at all, so the IDE would not rebuild without the unit that provides the registration interface. Any one of them alone leaves the same symptom, so all three are fixed together. Checked the only way that means anything: by installing the packages into an IDE and placing a component on a form with the mouse.
Pasting into the formula list did nothing in the Delphi build of the plugin. The panel is a page inside the plugin, and text pasted from the clipboard has to travel from the host to that page; the host recognised only its own saved state and dropped everything else on the floor. Both builds now decide the same way - the clipboard either holds a saved state, which is decoded and checked before it is trusted, or it holds plain text, which is handed to the page as text. The two builds are fed the same nine cases and required to answer identically, in either direction.
A step of the mouse wheel could be lost. The flag saying which way to zoom was written by the main thread and read - and cleared - by the timer thread, so a click that landed between the reading and the clearing vanished without a trace. Both ends are in the main thread now.
A unit the plugin needs was missing from the published composition, so the Delphi build could not be built from a fresh clone at all. The same class of omission had happened once before with another unit, and the warning about it was written down in the very file where it happened again. It is now caught by a check rather than by a reader.
Docked in a side panel, the plugin redrew its picture about twice a second while nobody touched it. The status line at the bottom has little room in a narrow panel, so its text wrapped: "ready" took one line, the report about the points took two. That changed the height of the bottom bar, the canvas lost and regained the same 64 pixels, the size observer read it as a real resize and asked for a rebuild, and the rebuild changed the text back. Measured on a docked panel: 36 rebuilds in 20 seconds of an untouched window, 437 ms of computation each. Now none, while a real resize still rebuilds. The status line keeps to one line and holds a fixed share of the row, so nothing it displays can move the layout. A floating window is wide enough that the wrap never happens, which is why the report named the docked panel and not the floating one.
The component that does the computing kept a window on screen underneath the page and painted nothing into it. Every time the container resized the panel, that window was told to repaint and left standing whatever had been there. Measured: seven such repaints for six resizes of a docked panel, not one of them drawing a pixel. It is off the screen now while the page draws; the computation is untouched, and results still arrive in that window from the worker threads.
The graph component painted outside the normal repaint cycle. An invalidation called the painting routine directly, which left the window still invalid, so the system sent a real repaint afterwards and the picture was drawn twice with the background erased in between; results from the worker threads went to the screen the same way, out of turn; and the tracing line was drawn over the buffer rather than into it, so it vanished at the next repaint. Now an invalidation marks the window and the system repaints once, the tracing line lives in the buffer, and the control declares itself opaque - it covers every pixel it owns, so erasing the background under it was only a flash.
A docking panel whose window was recreated stayed registered with Notepad++ under the old handle, and the editor had nothing live to put back into the dock. Registration now happens on every window creation, as the modeless registration already did. Three docking notifications that were declared and never handled - dropped after dragging, switched in, switched off - are handled as well.
Thirty-two bits, a package that asks for nothing, and a case the accelerator hid
Added
Thirty-two bits, on both compilers. Windows i386 joins win64 and linux64, and the whole battery runs there: sixteen test programs on Free Pascal 3.2.2, the documentation samples, the packages themselves. It is a separate installation of the compiler rather than a switch, because Free Pascal will not target i386 from a host whose Extended is a Double - and on Win64 it is.
The Lazarus packages no longer ask for the LCL. They are built with NOFORMS and NOGRAPHICS, so a console program links against them with nothing else in its uses clause - no Interfaces, no widgetset. Delphi is untouched by this: it builds from the sources, where neither define is set. Two features step aside for it, and the README says which and how to get them back.
Project files for the eight documentation samples. Open any of them in Lazarus and build - that is the whole recipe. They were written earlier but never reached a release: the slicer did not carry the extension, so the files existed and travelled nowhere.
Fixed
The accelerator got the order wrong when a function call stood on the right of a division. Reading the right operand consumed the rest of the term instead of one step, so 6 / cos(x) / 16 was evaluated as 6 / (cos(x) / 16), and x / sqr(y) * y as x / (sqr(y) * y). Only a call was affected - with a variable or a constant there the fold stayed left to right, which is why it hid. On x86-64 the emitter takes such formulas and the emitter is right, so the wrong answers surfaced only where there is no emitter. Checked by comparing three thousand random formulas against the interpreter on every target: zero disagreements.
The differential check that should have caught it was comparing nothing. It skipped every formula the accelerator declined, and off x86-64 that is every formula there is - the check reported three thousand compared and zero disagreements while comparing none of them. It now reads the level off the interpreter counter, and the floor it guards is a real number again.
The value record was a different size on 32 bits: twenty bytes instead of twenty-four, with the payload four bytes in rather than eight. The compiled script format carries that record verbatim, so a script built on 64 bits would not have loaded on 32. The directive that was supposed to keep the layout identical sets a limit on alignment, not a size, and on i386 nothing in the record asked for eight. It is now padded out by hand, and the layout is the same everywhere.
The package used to hand a unit of its own to anyone who installed it, under a name the system already uses. On Windows Messages comes from the runtime, and ours stood in front of it; the LCL does not survive that, and a project that used both stopped with a message naming a unit it could see. The stand-in is now added only where the system has no such unit at all.
Installing the accelerator package rebuilt forty-one units of the parser into a second directory of its own. The two sets of compiled units then disagreed, and a sample that used both stopped on a unit that was lying right there. The accelerator now uses what the parser package built, as it was always meant to: six units instead of forty-seven.
Three ways into an evaluation, and the mask now covers all of them
Fixed
Compiled code ran without the parser's exception mask. Compile a script with CompileScript and run the compiled object - which is what the accelerator documentation recommends for evaluating from several threads - and division by zero raised where the library promises infinity. Two of the three ways into an evaluation had been covered in 1.0.7; this was the third, and the one the documentation points at
A parser evaluated from inside another parser ignored its own ExceptionMask. The test for "is this the outermost evaluation" asked whether any frame existed in the thread rather than whether the mask differed from its own, so a nested parser silently inherited the mask of whoever called it
Arming a loop guard inside another one switched off the outer cancellation. A nested ArmLoopGuard without a flag of its own wrote nil over the flag that was there, so an owner asking the work to stop went unheard for the whole of the inner run. Budgets may be replaced by an inner run; cancellation may not
ExceptionMask was documented as yours to narrow and declared protected, which put it out of reach of the code that was supposed to narrow it. It is public now
Looking a name up in the parser tables converted the string to lower case twice per lookup, once for the hash and once for the comparison. Same string, same result, two trips to the memory manager. Deriv went from fourteen allocations per call to eleven and from 4.05 to 3.40 microseconds
Three pieces of thread state that belonged to somebody else
Added
ArmLoopGuard and DisarmLoopGuard arm the loop guard in a pair, and disarming puts back whatever was there before. The guard lives in thread variables, but a run does not: a budget that ran out is recorded as a negative number and used to outlive the run that spent it. Whatever came next in that thread inherited the refusal - a different parser, a later button press, code that never armed a guard at all - and was stopped on an honest ten turn loop. Arming nests too, so a formula that calls Parse may set a budget of its own
Fixed
The floating point exception mask was installed by the parser constructor, so it belonged to the thread that happened to create the object. Evaluate on a shared parser from a worker thread - the arrangement the plotting component uses - and division by zero raised EZeroDivide instead of answering infinity. In the other direction, a living parser held the mask for the whole program, and neighbouring code in the same thread quietly stopped getting its own exceptions. An evaluation now installs the mask and hands the caller's back, and the accelerator does the same around machine code. If you share one parser between threads, or if your program narrows the mask for its own arithmetic, this is the release that makes the documented behaviour true for you
The lock around Deriv and Parse was one lock for every parser in the process. Four threads with four unrelated parsers queued up behind each other on any formula containing a derivative. It is now a lock per parser, and Parse holds it only while it compiles: running the compiled script under the lock meant holding it across arbitrary user code, which is how deadlocks are made
The plotting engine has never built on Free Pascal 3.2.2 and cannot: a geometry dependency sorts points with an anonymous comparer, and function references arrived in 3.3.1. The parser next door does build with 3.2.2. Both facts are now stated - in the crossgraph README, and by the Linux build script, which says so instead of stopping with a syntax error in the middle of a file you did not write
The two buttons that send the report into the editor still showed up in the live demo, where there is no editor to send anything to. 1.0.5 taught the page to ask the host first, and the host answers correctly - but the buttons were being hidden with the hidden attribute alone, and that attribute is only a display:none from the browser stylesheet. The panel sets display:grid on its buttons, which wins. Measured on the published demo: hidden was true and the button was still thirty pixels wide
And underneath that, a second one it had been hiding. The panel asks the host whether there is an editor, and the Lazarus host answered in the same reply it uses to hand back the previous session - so whenever the panel opened with work in it, which is nearly always, the answer never arrived at all. It was invisible while the buttons were showing anyway. The greeting is now its own message and goes out first
The library builds with Free Pascal 3.2.2 again, and the Linux matrix says so
Added
Free Pascal 3.2.2 builds the library again. Function references arrived in 3.3.1, so on 3.2.2 the iterator callbacks are method pointers instead - you pass a method where you would otherwise pass an anonymous function, and nothing else changes
Nine functions 3.2.2 lacks in its Math unit - ArcCot, ArcCotH, ArcCsc, ArcCscH, ArcSec, ArcSecH, CotH, CscH, SecH - travel with the library, taken verbatim from the 3.3.1 runtime so the values agree to the last bit
MathFamilyTest guards that whole family by contract rather than by a table of numbers: a reciprocal multiplied by its base is one, an inverse returns the argument of the direct function, and ArcCotan answers in the branch it promises
The README says what the matrices run, including which two units ask for the LCL and how to switch them off
Fixed
Two accelerator tests and the thread-safety sample died on Linux before reaching their first line: on Unix the thread driver has to be the FIRST unit, and Classes standing ahead of it was enough to break that
A test compared a bound against Double(High(NativeInt)), which reinterprets the bits rather than converting the value - 0x7FFFFFFFFFFFFFFF read as a number is NaN. The comparison was silently against a meaningless value wherever the compiler took the cast literally
The accelerator now says why it declined machine code even when the interpreter picked the work up, so the contract about wide Extended can be checked at all
The Linux test script looks for the widgetset folder instead of naming one, so a Lazarus built with gtk2 no longer reports a missing Interfaces unit
The plugin reads the formula under the mouse, and sends the report back into the editor
Added
The build that ships - the Lazarus one - picks the formula up from the editor: point at a line and the curve appears, select an expression and the selection wins over the line. Only the Delphi build did that before, and the Delphi build is not what ships
The report travels back the other way: one button opens it in a new tab, another drops it at the caret
It leaves as Markdown with the curve embedded as SVG - text, so it survives in a text editor, and still a drawn curve wherever Markdown is rendered
The panel keeps one slot for whatever the editor offers, so pointing around a file does not fill the list with formulas nobody asked for
The line under the cursor is compiled by a parser the plugin keeps for that alone, in the thread the editor calls from: compiling on the parser that is drawing the graph is outside the documented thread-safe subset
Fixed
The README said to select an expression and press Alt+G, which was never how it worked: the formula is taken from under the mouse pointer, and Alt+G only opens the panel
An Exit reaches the evaluation it belongs to, and the thread-safety contract stops overpromising
Added
A routing test suite for Exit: recursion, a chain through one foreign parser, a chain through two, an Exit owned by the parser in the middle, the legacy constructor inside and outside an evaluation
A README section that states the thread-safety contract in full, including the one rule the previous text left out: every simultaneously active evaluation needs script storage of its own
The plugin carries version information and unpacks the way Plugins Admin expects, so it can be listed in the Notepad++ plugin catalogue
Fixed
A parser standing between an Exit and the evaluation it belongs to swallowed it: with A calling B and B calling back into A, the Exit raised in A ended up as the result of B, and A quietly finished a different sum. The exception now carries its owner, and only the evaluation it names may take it
Looking for the enclosing evaluation moved off the path of an ordinary formula: it is asked only when an exception actually appears
The package descriptions said "Copyright Yuriy Pisarev" where the repository is MIT, and carried a version unrelated to the product
One parser, many threads: Exit belongs to its own evaluation
Added
A thread-safety test that pins down who owns an Exit: parallel roots, recursion, two parsers in one thread, a notification that starts its own evaluation
The loop guards are documented: a README section with a compiled-and-run example, and the exact scope - guards belong to the thread and are set at the root of an evaluation
Fixed
Exit inside a formula answered to the thread scheduler: the nesting depth lived in a field shared by every thread using the parser, so a parallel Exit escaped as an exception and a lost update could leave Exit unusable until another race restored it - the depth now lives in a frame on the stack of the call
Exit inside brackets now ends the whole evaluation in both evaluation modes: 99 + (Exit(42)) is 42 everywhere, where the evaluate-up-front mode used to answer 141
The plugin archive is reproducible: repacking the same content gives the same checksum
A loop guard: a break flag and a turn budget, both off by default - a formula that never ends becomes a formula error, not a frozen tab or a killed worker thread
Unwind descriptions for generated x86-64 code on Windows: an exception thrown through it reaches the handler instead of taking the process down
Fixed
A deadlock on the first parse from a worker thread: the smart cache sent a synchronous window message across threads
Each coordinate system keeps a formula sheet of its own, the way the classic window always did, and a deliberately emptied sheet survives a reload
The intersection finder merged genuinely distinct neighbouring crossings as duplicates and silenced a fast curve as an indistinguishable stretch
Bulk evaluation fills the answers or says it did not; a formula the accelerator declines falls back to the ordinary parser
The plugin archive shrank from 9.6 MB to 1.4 MB: debug information no longer ships inside the library